One of the great unsung heroes is Log Parser Studio. This utility allows you to easily parse through gigabytes upon gigabytes of IIS logs to find the information you need. Without this tool, this task is tedious in a single Exchange server environment and is significantly worse in Exchange environments with many servers.
Log Parser Studio is great for migration planning and discovery and is a tool I have always had in my tool belt. It does not matter if you are migrating to a newer version of Exchange or Office 365; Log Parser Studio can aid in planning both scenarios. For discovery, I use it in the following two ways:
- First is to identify third-party integrations, such as those from a voicemail system, fax solution, or conference room system
- Second is to identify all client software connecting to Exchange
Once you have identified the third-party integrations and clients, you can add them to your migration plan and determine the next steps. This could include upgrading legacy Office clients or testing the integration of a third-party app against the target system.
Discovery with Log Parser Studio becomes especially useful in environments where Exchange predates the current IT team or where knowledge and documentation have been lost over time.
In this article, we will explore how to use Log Parser Studio to identify the multitude of client software and third-party integrations.
Let’s get started!
Installing Log Parser Studio
Log Parser Studio comes in two downloads. The first is the original command-line utility known as Log Parser. The second is Log Parser Studio, which was later developed to provide a GUI for that command line. We will need to download both components for this process.
Tip: I recommend installing Log Parser on a workstation and not directly on an Exchange server. That way we avoid adding unnecessary CPU cycles to the Exchange server.
First, we need to install Log Parser 2.2. Double-click on the LogParser.msi. On the installation screen, click Next. Accept the license agreement and click Next. On the Choose Setup Type screen, click Complete. Click Install. After the installation completes, click Finish.
Next, we need to install Log Parser Studio. Unzip the file LPSV2.D2.zip (I recommend unzipping this to your desktop). Open the newly created LPSV2.D2 folder and launch LPS.EXE.

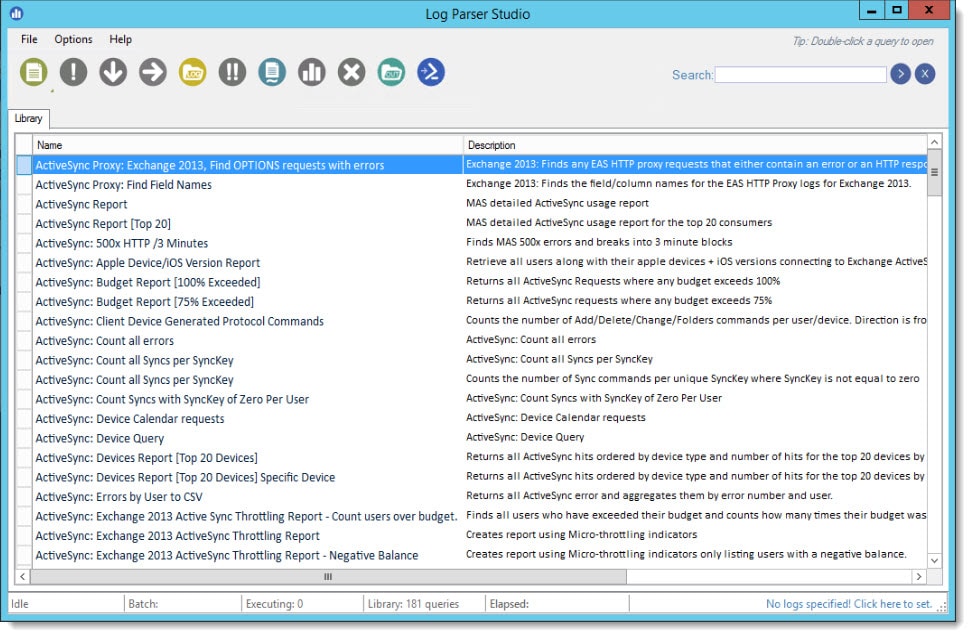
This will launch Log Parser Studio.
Importing queries into Log Parser Studio
As you can see from the screenshot above, Log Parser Studio (or “LPS” for short) ships with dozens of pre-canned SQL queries that can aid you in troubleshooting and reporting. For example, the query “EWS: Exchange 2013—Top 1,000 EWS requests by CPU used” helps identify all your EWS resource hogs.
However, for use with your migration discovery, here are a few more SQL queries for you to download and import into LPS. We will be using these throughout the rest of the article.
Note: I started posting the previous version of the query in case I release a query with errors. I recommend grabbing the latest one (they are versioned as YEAR.MONTH), but if it does not work right, grab the previous one instead.
Once downloaded and unzipped, you can import them into LPS by navigating to the File menu and selecting Import > XML to Library. From the Import XML Library dialog, select all XML files and click Open. From the Query Import dialog, select Merge Now.
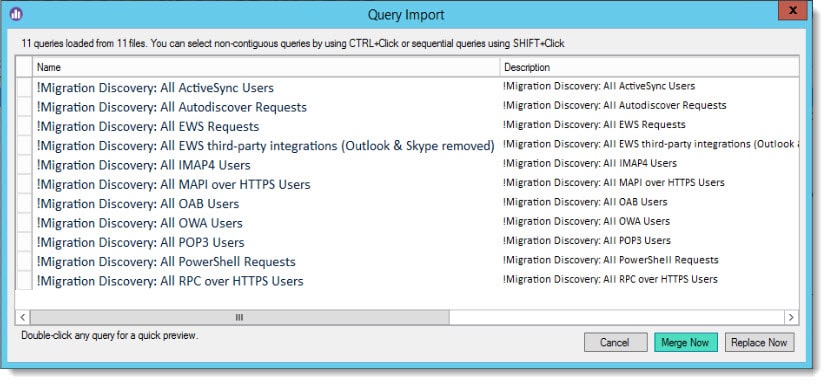
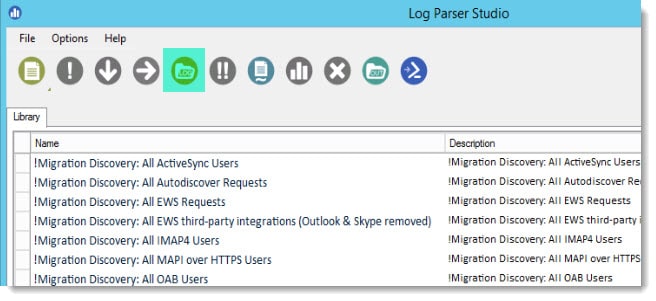
The queries will be imported. They are prefixed with an exclamation point to appear at the top of the query list.
Note: If you wish to change the query name, be sure to edit the XML file before importing it into LPS.
Gathering the IIS logs
The next step is to gather the IIS logs for parsing.
These logs are typically located on each Exchange Server under C:\inetpub\logs\LogFiles\W3SVC1. However, there is the possibility the IIS logs were rehomed to another drive or directory.
If you cannot find the logs, open Internet Information Services Manager, navigate to the Default Web Site and click the Logging icon (under Features View). If the directory is correct, then verify IIS logging is enabled from the Actions sidebar on the right.
Once you have your IIS logs located, it is easiest to ZIP them up to transfer those files between computers. As IIS has no native mechanism to truncate its own logs, you may have logs going back years. How many logs you plan to parse is really up to you. I typically recommend the last 2-4 weeks of logs.
Once your ZIP file is transferred to your workstation, unzip it to a location that makes sense. Then, from within LPS, click the Choose log files/folders to query button.
From the Log File Manager dialog, click Add Folder. Navigate to the folder you previously unzipped and select a log file (this actually selects all log files in that folder).
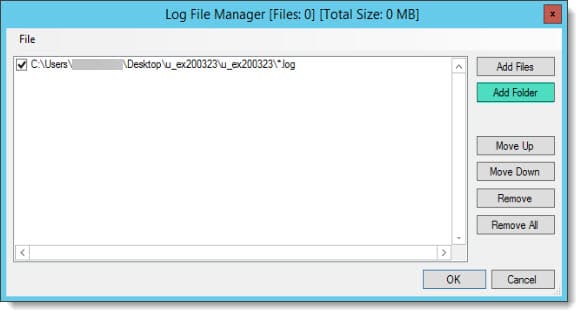
Click Ok.
Launching a query with LPS
With our logs loaded, we are ready to perform a query. Let’s use the query “!Migration Discover: All EWS Requests”.
To do this, double-click on the query. This will launch the query into a new tab named Q1. Each query you double-click on launches in its own tab, becoming Q2, Q3, and so on. You can right-click on these tabs and rename them if you like. Click on the Q1 tab.
The top half of the window displays the query results, and the bottom half displays the query that will be run.
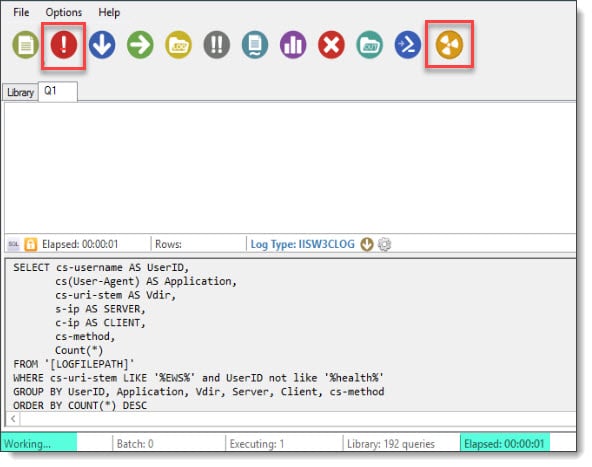
Note: If you want to edit this query, click the orange padlock icon. This will change the background of the bottom half of the window from grey to white. You can now edit the query as you please.
To start the query, click the red exclamation icon. Depending on the size and number of logs, your query could take quite some time to run. If so, you may wish to reduce the number of log files you have included in the previous section. For example, I would only scan the log files from a single server or only one week of logs at a time.
While the query is running, you will see several indicators. The first is a rotating radioactive symbol in the toolbar (this disappears when the query is complete). The second is the status of Working and an Elapsed timer in the taskbar.
When the query is complete, the results will be displayed in the top half of the window. By default, this query sorts the results by descending count, but you can manipulate the results in any of the columns by clicking the column header.
From the result pane, we can quickly determine what kind of client software and third-party integrations are leveraging Exchange Web Services (EWS). By clicking the Application column, we can sort these applications by name. Data from the Client and UserID columns helps us identify what users or servers are making the connection. Data from the Count column identifies the frequency with which applications connect to Exchange Web Services.
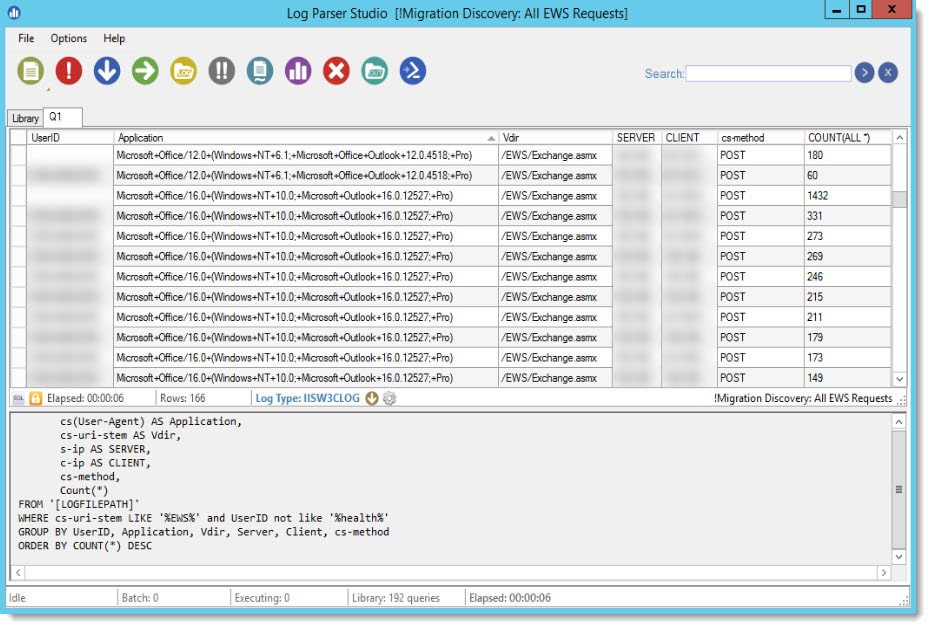
For example, the screenshot above shows many instances of Windows 10 and Office 2016 (which meet the minimum requirements of Office 365 and supported Exchange versions).
However, we also see instances of NT+6.1 and Office+Outlook+12.0.4518. These are the build numbers for Windows 7 and Office 2007, both of which are out of support. From the report pane, we can then identify which users and machines have these older versions (blurred out) and devise a migration strategy.
Items I commonly see in this report, outside the various Outlook versions, include:
- Unified communications (e.g. Skype, Jabber)
- Unified messaging (e.g., Cisco, Avaya)
- Room systems (e.g., Crestron)
- Mobile Device Management (e.g. AirWatch, Blackberry)
- Customer Relationship Management (e.g. Microsoft CRM)
- Line of Business applications
- Ticketing and helpdesk systems
- Health Checks (load balancers, monitoring solutions)
- Mobile calendaring apps (from Google Play or iTunes)
- Scheduled PowerShell scripts
- Custom applications developed in-house
The applications you identify in the report pane should be validated and tested against the target environment. Any apps that fail will need a migration strategy. This could be to a newer version of the product or an entirely new solution.
You may also wish to modify the queries to squelch any noise. You can do this by clicking the yellow padlock above the query pane. The current queries already parse out anything that identifies as a HealthMailbox. However, you may also wish to squelch health checks performed by load balancers or external monitoring solutions. These can create a lot of noise in the logs.
If you need to share these results with others, you can export the contents of the results pane to a CSV. To do this, click the Export button (green arrow) in the toolbar. You will be prompted with a save dialog box. You can then manipulate this data with Excel.
Common Issues & Troubleshooting
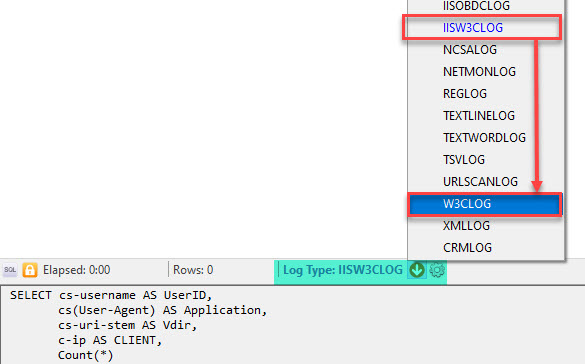
If you are not getting any results with your query, it might be because X-Forwarded-For data has been added to your IIS logs. X-Forwarded-For is a mechanism that allows load balancers to forward the original client IP to the Exchange server. This is useful when the client IP column (a.k.a. c-Ip) only returns the load balancer’s IP.
However, this may result in zero results. To fix this, switch your query to use a log type of W3CLOG (rather than IISW3CLOG).

What applications have you identified when parsing the Exchange logs? Drop a comment below or join the conversation on Twitter @SuperTekBoy

Gareth,
Is it possible to adjust the time by subtracting 4 hours in an IIS log using SQL? I tried this but apparently the syntax is wrong: “SELECT date, time – 4 AS TIME_EST, cs-username, sc-status, sc-win32-status, time-taken, cs-uri-query”
The important part of this statement is this, which is wrong: “time – 4 AS TIME_EST”